Dashboard Update: Eagerly Watching for Progress on Policy and Population Health
Fred ZimmermanWhen the Republicans assumed complete control of the federal government, including both houses of Congress and the presidency—and now increasingly the courts—they made a number of attractive promises. Donald Trump told us that everyone would have better and cheaper health insurance, that the economy would grow at 4% per year, and that he would rid Washington of corruption by “draining the swamp.”
A lot of these promises matter a great deal to population health. After all, public health is about ensuring the conditions in which people can be healthy, according to a 1988 Institute of Medicine report.Conditions including a rapidly growing economy, increasing incomes, and high quality and accessible health care are certainly favorable for population health. So how’s it working out?
This past July, I said I would be watching to see how well those in  power are keeping their promises, and explained which metrics I would be watching and where I’d get the data. I chose 7 topics, all related to promises made during the campaign. I thought there might be some subtle signs in the data about what direction we’re heading. It turns out the signs have not been all that subtle, but I still think it’s useful to follow the data.
With the Republicans in office just one year, data are not yet available to evaluate progress on all of their promises, but a few indications are emerging. We’ll know more in six months and even more in a year. With all that said, here’s my first report.
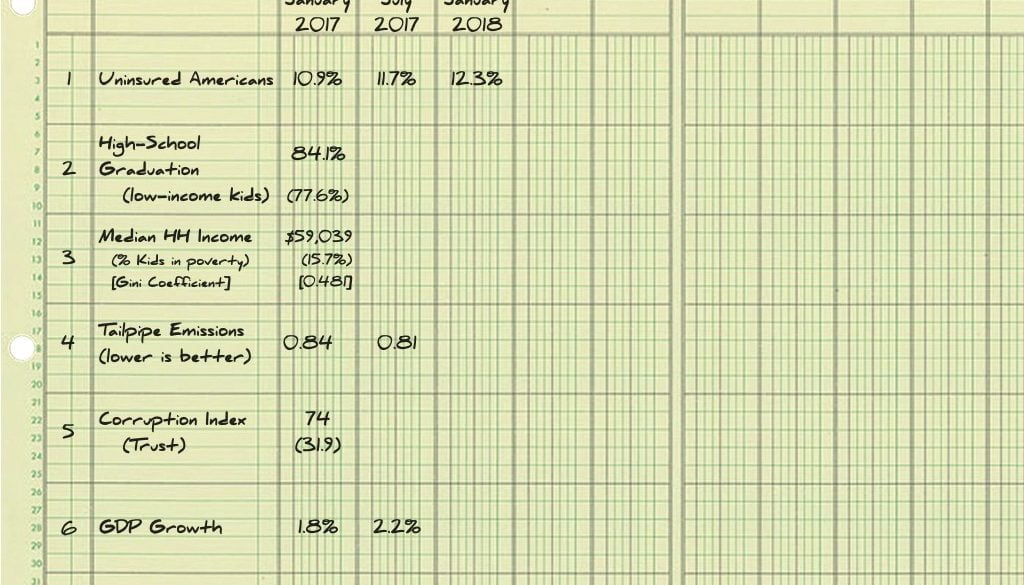
- Data on health insurance are available pretty quickly, and I was surprised by the failure in keeping Donald Trump’s campaign promise to make sure everybody is covered, which, as he said is “just human decency”. Progress here has not been promising. Under Republican control of the government, the percent of American adults who lack health insurance has risen by 1.4 percentage points—totalling 3.4 million people who have lost their coverage.
- GDP growth has been about half of the target set by Trump.
- Tailpipe emissions have actually improved slightly, but mainly because of increased vehicle efficiency, not due to any regulatory improvements.
- The jury is still out on most of these measures, but it’s clear which way the wind is blowing on at least one. A new reading for Transparency International’s corruption index is not yet available, but 60% of Americans say their country became more corrupt in 2017.
[fusion_separator style_type=”default” hide_on_mobile=”small-visibility,medium-visibility,large-visibility” class=”” id=”” sep_color=”” top_margin=”” bottom_margin=”” border_size=”” icon=”” icon_circle=”” icon_circle_color=”” width=”” alignment=”center”][/fusion_separator]
Sources:
1. Uninsured Americans is from the Gallup Survey.
2. High-School graduation is from the Common Core of Data from the National Center for Education Statistics.
3. Median income data are from the US Bureau of the Census (via St. Louis FRED), series MEHOINUSA672N. The percent of children in poverty is from the Census report on the Supplemental Poverty Measure. The Gini coefficient is from the Census Report on Income and Poverty in the United States .
4. Tailpipe Emissions are from the University of Michigan’s Transportation Research Institute.
5. Corruption is from Transparency International. Trust is from the General Social Survey: it is the percent of respondents who say that generally speaking, most people can be trusted.
6. GDP growth is from the Census series A191RO1Q156NBEA.
7. The percentage of GDP paid in taxes is calculated by dividing the OECD’s data for total taxes by the GDPA series from the St. Louis FRED database.


All comments will be reviewed and posted if substantive and of general interest to IAPHS readers.