Dashboard Update: Some Worrying Trends on Policy and Population Health
Fred ZimmermanIt’s time for another installment of the dashboard of progress toward population health.
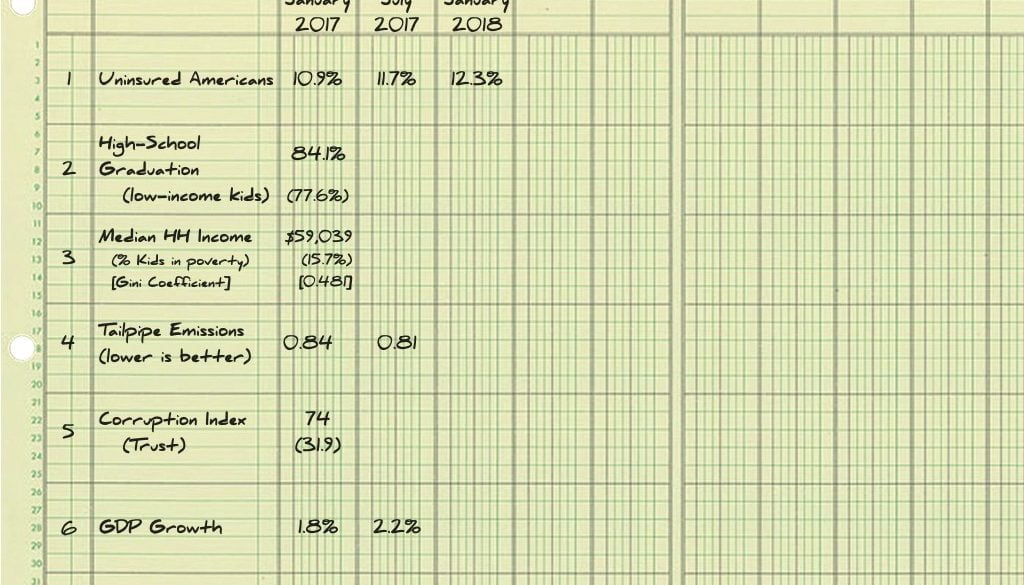
I previously wrote that I’d be tracking several indicators of the promises made by the incoming administration around issues likely to influence population health: opportunity (as proxied by high-school graduation), health insurance rates, median income, taxes, greenhouse gas emissions, corruption and GDP growth. President Trump and the Republican party promised improvements in all of these areas—except taxes.
In the previous uptick, I noted a mixed record. Median income had inched upward, and tailpipe emissions had fallen slightly. On the other hand, GDP growth had been about half of the 4% per year promised by President Trump, and perceptions of corruption were notably higher.
This update brings more of the same mixed record. Some indicators are only available after a considerable lag, and the jury is still out on high-school graduation. But a steady picture of the first 12 to 18 months of the Trump administration is now beginning to emerge in population data. Median income continues its slow upward trend, but while the number of children in poverty has ticked down slightly, it remains stubbornly high.
Within this mixed record are some worrying trends.
Greenhouse Gas Emissions
Because the measure of tailpipe emissions was discontinued, I’ve replaced it with a 3-month moving average of US gasoline production, taken from the government’s Energy Information Administration. This measure fluctuates seasonally, with annual averages increasing slowly since the President took office. The US is clearly not on track to meet its climate commitments in the transportation sector, now the largest contributor of greenhouse gas emissions. On the contrary, the Trump Administration is actively working to reduce efficiency in transportation by weakening the Corporate Average Fuel Economy (CAFE) standards in place since the 1970s.
Such a move is dangerous to public health for many reasons. In addition to reducing progress on greenhouse gas emissions, weakening CAFE standards would also lead to more point pollution around freeways and in heavily populated areas. After falling for years, for example, smog in and around Los Angeles has plateaued and is no longer improving. What’s more, there’s a health-equity issue as well, as it’s the low-income areas of the greater Los Angeles that suffer the largest number of poor-air-quality days, not the wealthier, whiter coastal areas. Scaling back CAFE standards will make these problems worse.
Those in public health should be particularly concerned that the rollback of CAFE has been accompanied by unsubstantiated public health claims that it will make cars safer, using arguments that have been debunked by experts and in some cases rejected outright by the Administration itself in other contexts.
There is a vigorous opposition to the Administration’s moves in these areas, and the next years will be critical ones for the development of the electric-vehicle market.
Uninsured Americans
A report from the Census Bureau released in August 2018, shows that the percentage of uninsured Americans held steady in 2017, rising from 12.1% to 12.2%. These results differ from estimates from Gallup, which showed a steady increase in the uninsured throughout 2017, ending at 12.2% by the end of that year. What accounts for the difference? The Gallup estimates are for Americans aged 19-64, while the Census estimates are for all Americans.
A year from now we will know what happened to rates of uninsurance in 2018. There are many crosscurrents that will affect rates of insurance—the aging of the population, the strength of the economy, changes in state policy. One of the most consequential may be the elimination of the individual mandate, passed as part of the tax cut in December 2017. An analysis by the Urban Institute and the Commonwealth Fund finds that if each state passes its own individual mandate, an additional 3.8% of Americans will be insured who otherwise wouldn’t be. Turning this figure around implies that the adverse effect of the mandate repeal would be to increase the percentage of uninsured Americans from 12% to over 15%, although some of this increase will be prevented by action at the state level. Stay tuned for important developments over the next year.
What do you think? What else should we be tracking? Share your thoughts in comments.


All comments will be reviewed and posted if substantive and of general interest to IAPHS readers.