What Will #FlattenTheCurve Do?
Jimi AdamsEarlier this week, I posted a piece, making 4 main points about responsible statistical modeling and how those modeled expectations should shape our COVID-19 response:
- Projecting the expected number of total cases of COVID-19 currently relies on limited, rapidly changing, and noisy data, and therefore includes substantial uncertainty.
- R₀ (the average number of additional cases expected from each existing case) has little association to the ultimate extent of an outbreak.
- Current mortality estimates are primarily derived from confirmed and symptomatic cases (so should not be applied to models of all potential infections), are likely systematically high, and biased.
- Response efforts need to include scaled up testing availability and social distancing efforts to help “flatten the curve,” in addition to personal protective behaviors.
Two of the key dimensions for population-level responses at this point¹ are testing and social distancing. But it’s really important to make sense of what effects we can expect from those interventions, because some effects may be surprising.
Why might cases increase?
Let’s start with testing. To date, the scale up of testing availability in the US has been painstakingly slow. As those efforts continue to improve, what’s likely to happen? The simplest answer is that we’d find more cases that already exist. That is, improved testing will cause an uptick in identified cases. That’s not a particularly profound claim, but it’s important, because casual observers likely assume that beneficial interventions will generate declines in new cases, not increases.² We don’t want them to be surprised when numbers go up.
At the moment, we just don’t know how big our unknown caseload is in the US. Improved testing may generate a sizable jump in cases on par with what China observed after altering case definitions. We could see a smaller increase. Or, since community spread has likely been ongoing in the US for some time,³ increased testing could identify an even larger undetected outbreak already here.
Why is testing an intervention? Again, this is perhaps obvious but worth restating. Testing allows for proper treatment and isolation of cases, and alerts their contacts to vigilantly observing their own symptom development.
How should “flattening the curve” alter caseloads? This really depends on your assumptions. The basic notion behind epidemic mitigation through curve flattening, focuses on slowing infection timing. There are two things that aren’t always easily understood about flattening the curve.
Since we’re already on the topic of caseload, let’s start there. When people look at the flatten-the-curve illustrations, many are inclined to ask whether the area under the curves are drawn to scale and thus represent their respective scenarios’ total expected caseloads. In the initial formulation, they’re actually kept constant to address whether — even if we can’t reduce cases⁴ — we can change the timing of cases to make treatment more manageable (see below). Naturally, we aim to complement these approaches with other interventions (e.g., improved treatment regimens; see solid lines in the image above) that can also reduce the caseload, but flattening the curve doesn’t depend on those additional changes.
A second aspect that’s often misunderstood is that, compared to an unaltered outbreak, flattening the curve will actually— by design — extend the timeline of the pandemic, rather than bringing things to a quick resolution. In doing so, it could actually generate more cases in the long run. So, why would we do something that will lengthen the outbreak, and could potentially lead to more infections?
We’re trying to not overwhelm the healthcare system
The primary goal of flattening the curve is to reduce the caseload burden — at any point in time — on the health care system.
The US has about 2.8 hospital beds per million people (or just under 1 million total). Of those, about 50,000 are in ICUs. We have a supply of about 160,000 ventilators. While estimates are changing rapidly, conservatively expected caseload and hospitalizations per case would project we’re going to surpass this capacity. Such excesses⁵ could lead to what we’re observing currently in Italy and Iran, where doctors are forced to choose who gets treated and who doesn’t.
Flattening the curve to avoid this scenario has two complicating factors. First, the total capacity doesn’t account for approximately two-thirds of those beds already being occupied on an average day. This means it would actually only take a few hundred thousand COVID-19 cases needing hospitalization to exceed the existing capacity. Second, COVID-19 related hospitalizations last a while. On the plus side, it seems cases’ infectiousness levels off around 10 days after symptom onset, even if maintaining viral detectability. However, recovery takes weeks, not days.
The possibility of cases outstripping capacity is why we’re seeing aggressive moves towards social distancing, including university and school closures (or moving to online-only instruction), cancelling large events,⁶ and even comprehensive regional shutdowns. Social distancing is one of the primary weapons we have to flatten the curve. It’s also likely that the longer we can push off infections, the more effective our available treatments will become.⁷
How long will we need to keep up social distancing practices? When people hear that the incubation period is somewhere between a few days and two weeks, or that recovery — to the point of reduced infectiousness — can occur in under two weeks after symptoms, they are prone to assume we might get through this outbreak on a similar timeline. That’s just not the case. Most experts expect we’ll need to maintain social distancing practices for at least a month to six weeks, potentially more.
What will recovery look like?
While we’re still primarily focused on mitigating spread and severity of complications, it’s worth considering the nature of recovery.⁸ Unfortunately, the timeline for COVID-19 recovery is longer than for flu or other common respiratory diseases. The good news is the overwhelming majority of infections will recover, and we’re already seeing that appear in tracking data.
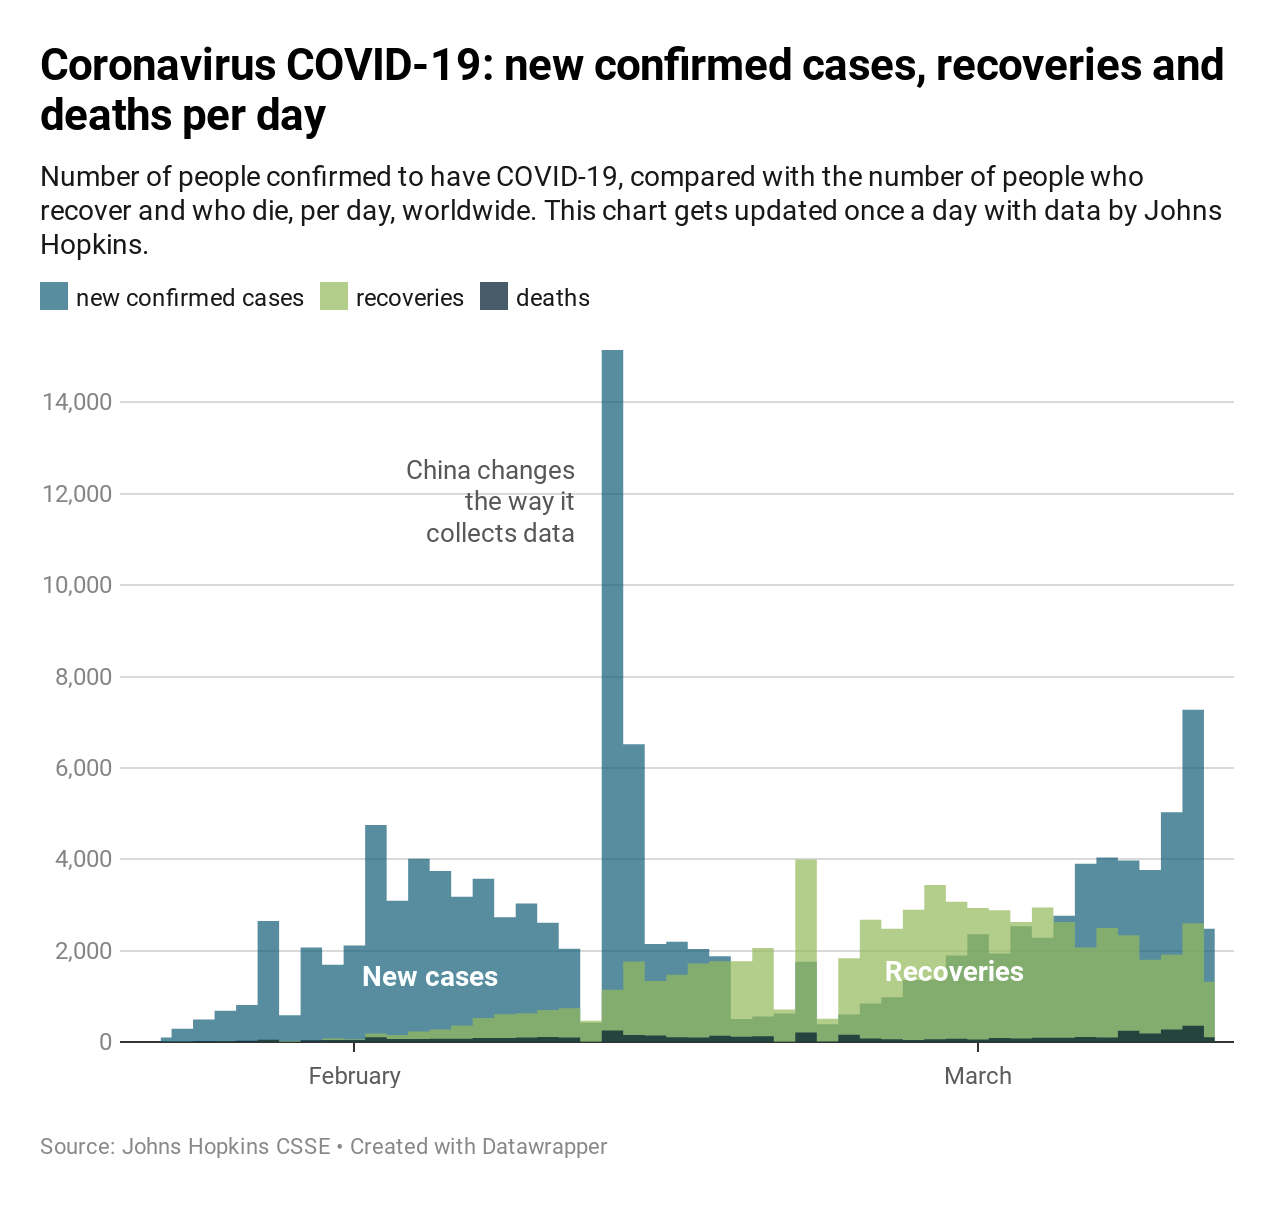
But are recovered cases re-susceptible? That’s less clear. Most suspect that recovered cases will develop at least some short-term immunity. But we’re too early to tell how that will hold up over time. And while infectiousness declines with time, that doesn’t mean recovered cases are fully in the clear. Furthermore, while individual cyclicity is important, we should also ask whether we expect this pandemic to be a one-off, or will we hear from it again? There’s some expectation that we’ll see an additional peak of cases in the fall, and speculation about seasonal recurrences into the future.
Social distancing requires substantial disruptions to our daily lives. If it works as designed, we can avoid crushing our healthcare system, and therefore save lives. Some of the implications of these approaches working may seem counter-intuitive, even appearing as though they’re making things worse. But that misunderstands how social distancing will work, and shouldn’t be interpreted as support for the unsubstantiated claims that social distancing is an over-reaction.
Additional resources: Harvard has among the most comprehensive sites I’ve been using.
Notes
[1] It would have been better if these were our responses weeks ago, but as the saying goes, the second-best time is now.
[2] When I’ve taught this idea, students have rarely predicted that increase; however, as soon as I explain the expectation, it’s readily apparent why that would be the case.
[3] Ongoing community transmission is one of the conditions for defining this as a pandemic, a step the WHO took on March 11th.
[4] That is, to focus solely on the timing — independently from the number — of anticipated cases.
[5] See the purple area in the image above.
[6] In fact, my university just sent out a communication canceling any non-essential gatherings of any size.
[7] This is why the flatten the curve image above allows for changing capacity (orange line), whereas it’s flat in many versions of this figure. Jamie Jones has posted code for estimating a number of potential scenarios.
[8] Treatment’s important in its own right, but we also know how treatment can act as prevention for infectious diseases.





All comments will be reviewed and posted if substantive and of general interest to IAPHS readers.